Human activity in industrialized nations around the globe – including manufacturing, energy generating, and farming, among other things – burn fossil fuels and create pollution that is released into the environment. Heavy metals, persistent organic pollutants (POPs), and Polychlorinated biphenyls (PCBs), which have all been known to cause health problems in humans, are some of the main pollutants of concern.

Although the pollutants are usually released at low or mid-latitude levels, they rise quickly because of convection and travel around the world on global wind patterns and ocean currents. As scientist Glen Shaw explained in Arctic Haze, pollutants can travel 5-10,000 miles, reaching the Arctic in just a few days! These wind patterns can be observed on Google Earth Weather Layer.
Unfortunately, the pollutants don’t leave the Arctic anywhere near as quickly as they arrive. The pollutant-ridden air molecules, now cool and heavy, sink down because of convection. With little sun, especially in the winter months, to warm the air and allow convection to continue, the pollutants remain stagnant in the Arctic ecosystem, sometimes for months.

Shaw was one of the first scientists to encounter the problem of Arctic Haze when looking for a “pristine” environment to compare Arizona air quality to. When he arrived in the Arctic, he saw instead what Yu’pik Eskimo Matthew Dean describes as a decreasingly transparent sky.

There are several concerns about the effects that the pollutants may be having on global climate change. Many of these are outlined in NASA ARCTAS Mission. What is the impact of aerosols and other particles on radiation? Do they reflect sunlight away from earth? Do they cause warming in the atmosphere? Or cooling at the surface? NASA and other organization are looking into how the PCBs and other pollutants are affecting global warming, sea ice minimums, and rising sea and ocean levels.
We do know that contaminants such as mercury, PCBs, and other dangerous pollutants that are building up disproportionately in the fats of animals in the eight Arctic countries. The Arctic Monitoring and Assessment Programme has found record levels of gaseous mercury in Barrow and PCB over the entire Arctic ecosystem.
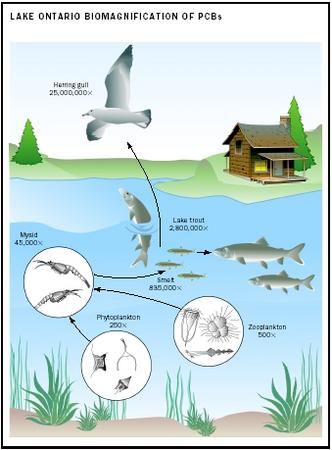
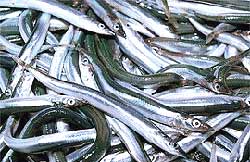
This is a big threat to Arctic animals and the humans who eat them. Animals exposed to the pollutants absorb them either through the water or air, and the toxins move up the food chain. Particularly toxic are animals at higher trophic levels – such as seals, polar bears, glaucous gulls, and toothed whales – because they eat large quantities of food higher up on the food chain and thus are more adversely affected due to biomagnification.
Because different Native populations in the Arctic countries eat different things according to culture, tradition, and availability, guidance concerning diet must be given locally. Altering traditional diets poses a dilemma for the world community because changing it could mean breaking with cultural and hunting traditions that go back hundreds of years. Additionally, established diets have health benefits that Native people have become accustomed to. For example, seal meat contains an important amino acid that can reduce the chances of cardiovascular disease.


Extend
I read an interesting study, “High Levels of PCBs in Breast Milk of Inuit Women in Arctic Quebec,” written by Eric Dewailly, Albert Nantel, Jean-P. Weber, and Francois Meyer.

The study analyzed 30 mL breast milk samples (obtained within the first month of lactation) of 24 Inuit women who delivered in the Hudson Bay hospital in Povungnituk. The data was compared to 30 mL samples of breast milk from 19 Caucasian women who delivered in Quebec City and 29 who delivered in Baie Comeau, on the north shore of the St-Lawrence River.

The results were shocking – the mean level of PCBs in breast milk for Inuit women was 111.3 micrograms/L compared to 28.4 micrograms/L for Caucasian women. That is almost five times as much PCB in Inuit women’s milk – the highest levels ever recorded!
All women who volunteered to participate in the study filled out a survey telling what they ate during their pregnancy and while nursing. For the Inuit women, the mean consumption of marine mammals was 10 meals per month, fresh water fish was 18 meals per month, and sea fish was 9 meals per month.
As was explained in Contaminants in the Arctic Food Chain, studies done in West and East Greenland have also shown record high PCB levels in pregnant women. In fact, 50% had so much PCB in their bodies that it exceeded the Canadian Action Limit of 100 micrograms per liter of blood.
A Google search will reveal the plethora of research being done to reveal that PCBs can affect fetal brain development. PCBs increase thyroid hormone (TH) metabolism and binding to TH transport hormones. This lowers circulating blood levels of TH. “Epidemiologic evidence suggests a link between PCB exposure during fetal development and subsequent cognitive problems in children, such as lowered overall IQ, attention and motor deficits, and impaired impulse control.”
The idea that the waste of industrialized societies is affecting the people who debateably have the the smallest carbon footprint is terribly ironic and incredibly sad.
Reading the study “High Levels of PCBs in Breast Milk of Inuit Women in Arctic Quebec” and realizing that some of the only people left on our planet that still live sustainably off the land are the ones whose babies are being sucepted to nearly five times as many PCBs as mothers in moreindustrialized areas is downright depressing.
It goes without saying that industrialized nations have a responsibility to “clean up our act,” especially in light of this relatively new research. As citizens, I think our most effective techniques (because we can all actually do these every day without any major lifestyle changes) are education – especially the informal kind, in daily conversations – and leading by example in the effort to reduce, reuse, and recycle.
A couple of other resources I found that I appreciated on Teacher Domain this week were Contaminants in the Arctic Human Population and the Antarctic Food Web Game. The Arctic Ecosystem, and Antarctic Ecosystem are also good.
Resources for Teaching the Western Side of Atmospheric Science How and why is the pollution of industrialized nations traveling around the globe???
Google Earth Weather Layer
This is a pretty incredible online tool. I really like how I can zoom in on the Kenai Peninsula and view the current temperature and cloud cover, and observe the pattern the storms are traveling in over the state.
Like the application that allows you to pinpoint earthquakes and their magnitude within the last hour, the weather layer is empowering for students because it allows them to have current information about their world.
I like how this resource allows students to get a good visual of the four layers of the atmosphere. The introduction explains right off the bat that density and pressure both decrease with distance away from earth, but temperature follows a different pattern. It is nice that students can see temperature, pressure, and objects entering the various layers of the atmosphere both separately and together on the graph.
I do a project with students where they graph the temperatures of various points in the atmosphere and connect them to view the zigzag pattern. (You might be able to find some data points at the Atmospheric Science Data Center for graphing.) This allows students to observe on their own where the temperature stops decreasing and begins increasing (end of troposphere, beginning of stratosphere), then stops increasing and begins decreasing again (end of stratosphere, beginning of mesosphere), etc.
After creating this graph, students are usually able to make fairly accurate predictions about where the atmosphere layers are, and then we discuss why these layers exist and what they mean in terms of human activity, such as flying planes and space shuttles.
I think this interactive would be a good “check” for students after completing their own graphs, especially because it explains that scientists have correlated changes in chemical composition with the temperature change.
I have used the McDougal-Littell science program before, as our district has adopted a lot of Houghton-Mifflin products, so I have seen this diagram before. The interactive is a great aid to help students visualize what is happening as an air front moves it. They can observe the cloud types that form and make predictions about the resulting weather that might roll in.
I love the images in this National Geographic resource. It would be great to view this resource before using Google Earth, since the satellite shots are similar. I like how the author asks viewers to think of the atmosphere as a fluid, rather than “air,” and shows Troy surfing both vertically and horizontally. Thinking of the atmosphere in this way helps in understanding the pressure that the atmosphere exerts on us down here at the bottom of the troposphere.
The diagrams provided in this video clip help to understand how the atmosphere and ocean work together to determine weather patterns. I like how it explains how pressure differences create surface winds, that create surface currents, that in turn affect deep water currents because of convection.
This is sometimes a hard concept to convey to students, as they tend to initially think that wind is the main reason for currents. They forget (or never really understand) that in some places like the Mariana Trench, the ocean is as deep as 6.78 miles – way too deep and way too much water to be affected by surface winds!
With the younger students, I sometimes do a quick lab where they fill a clear basin with water and make five “floating boats” and five “sinking boats” out of tin foil (a quick lesson on factors that affect density right there). Then, the students become the wind by blowing on their oceans through straws. Of course, only the surface “boats” really move, and students get the idea that other factors must be affecting those deep ocean currents. Then, we can discuss convection, the Coriolis effect, etc.

Me doing the lab at the Seward Sea Life Center
This video would be a good follow up for that lab, but more appropriate for students 4th grade and up, I would say, because it requires that one pays close attention to get then gist of it.
I love how this resource explains how jet streams winds are created and how they affect global weather patterns in small segments illustrated by visuals. This always helps kids conceptualize a hard-to-grasp concept. Having students go through this in partners or one-on-one, allowing them individual time to process, could be very beneficial. I will use this one for sure! (I could not find the “5 day view of the jet stream,” though, on the intro page. Maybe it was just not loading properly. Did anyone else find it?)
The Jet Stream and Horizontal Temperature Gradients
I like how this interactive is guided by questions, so students have an expectation to live up and they understand what they are supposed to be getting out of the resource to right off the bat (not to say they can’t get more out of it, or explore further). It is interesting to watch the wind speed by altitude change as a result of the temperature and latitude.
I like how this interactive is guided by questions, so students have an expectation to live up and they understand what they are supposed to be getting out of the resource to right off the bat (not to say they can’t get more out of it, or explore further). It is interesting to watch the wind speed by altitude change as a result of the temperature and latitude.
I like the graphics provided by the explanations for weather by Weather School. These will help students to understand the concepts.
The time-lapse photo of water vapor motion moving across the planet in the course of a year is pretty incredible. This is another resource that will give students current information and empower them as scientists.